The received raw fluorescent files are imported into a custom-build histomorphometry program that operates on a 24 node cluster computer. The program has four major components:
1. Alignment: The 8 layers per group are digitally aligned using the fluorescent beads that were place on the section. The beads provide the data to correct for changes in rotation or shrinkage of the tape. The image reproduces what the computer interprets as the visual image.
2. Identification of the ROI: The program draws the ROI based on computer-defined rules of a fixed size and distance from the growth plate and endocortical surface.
3. Thresholding: After background-correcting algorithms are applied, the 8 signals that captured are converted to a binary (present or absent) signal.
4. Projection: Seven of the fluorescent signals are drawn onto the surface of the bone (8th signal) based on computer defined rules of distance selection. The percentage of the bone surface that has each of the 7 signals on the surface produce the dynamic, osteogenic and osteoclastic activities within the ROI.
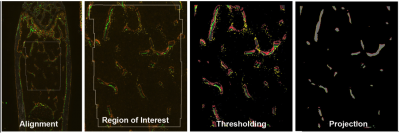
Figure 1: The four major steps that are performed in the image analysis program. The alignment step is dependent on the registration beads that are embedded in each sample. The process corrects for minor degrees of rotation and expansion-contraction of the tape during the enzymatic steps. The region of interest requires that defects within cortical bone have to be crossed to maintain the surface of the cortical bone. Once the cortical bone is identified, then the ROI can be determined. The thresholding step corrects for background and uses algorithms to distinguish the presence or absence of each signal corrected. The result is a binary map of each signal relative to the trabecular bone. Projection moves each signal back to the surface of the bone and is used to measure the percentage of the bone surface that contains the signal. The distance moved is particularly important for the MAR measurement.