A server-hosted database (Filemaker) that can be accessed by all members of the research team (via VPN for those outside the UConn Health building) has been built to facilitate information transfer from one site to another. The entry page (figure 1; see below) is customized for each work site and is designed to facilitate the necessary input information about the processing and analysis steps, and subsequently to view the resulting data. It is from the information that is developed on this laboratory information management system (LIMS) that data is developed and passed to the website for public distribution and query.
Based on the workflow described above, the following step are followed.
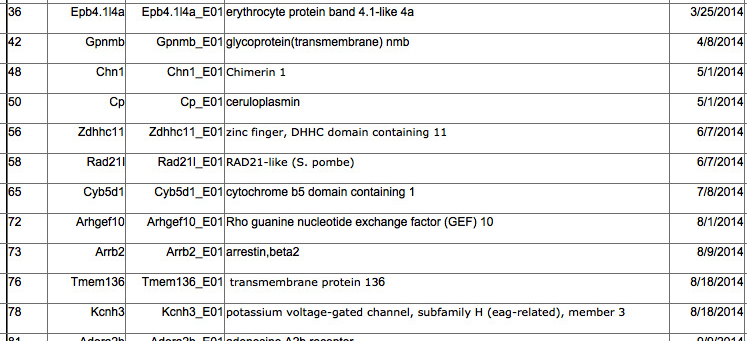
A. KO lines that have been identified for study: This information is provided by the laboratory staff at Jackson Lab in Bar Harbor. It comes for the central KOMP facility as animals that have or currently have passed through the general phenotyping pipeline. We receive breeding pairs from the facility and breed specifically for the skeletal phenotyping under defined animal housing conditions. The table projects when samples will be received and the status of samples still in production.
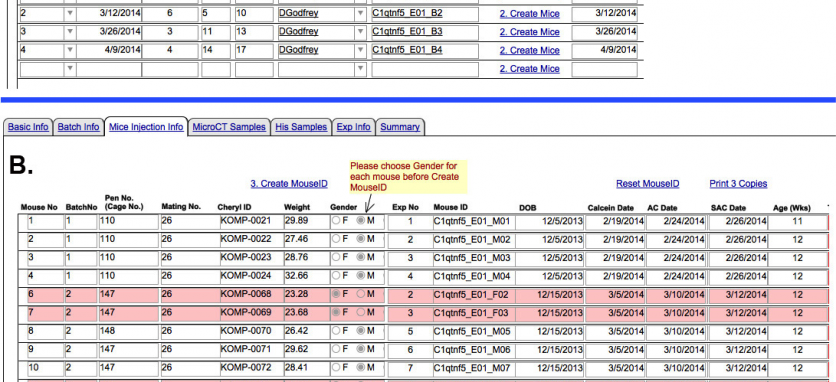
B. Breeding and harvesting mice for analysis: As the lines are established and breeding progresses, mice of the appropriate age are given the mineralization dyes and sacrificed for tissue harvesting. Since each breeding line may take a number of months to fulfill our desired number of males and females (8 of each), the dissected tissues are sent in batches. The record of each batch and the individual mice that comprise the batch are assigned a unique identifier. Entry fields are provided for individual entries that will track the batch and individual mouse (figure 3A). Thus in the figure below, the C1qtf5 line required 4 batches of shipments to produce the 16 mice necessary for study (figure 3B). One anticipated animal (#5) died prior to shipment and was replace by another (#17). All of this information is provided by the Jackson staff.
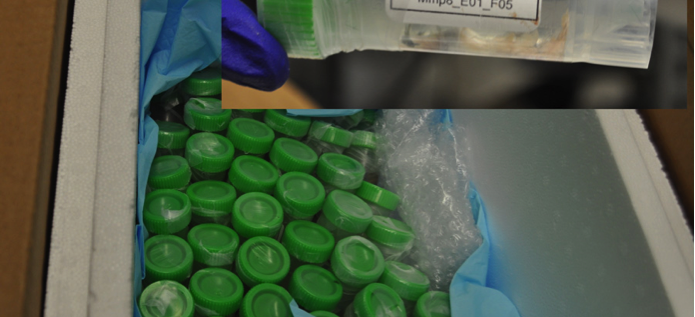
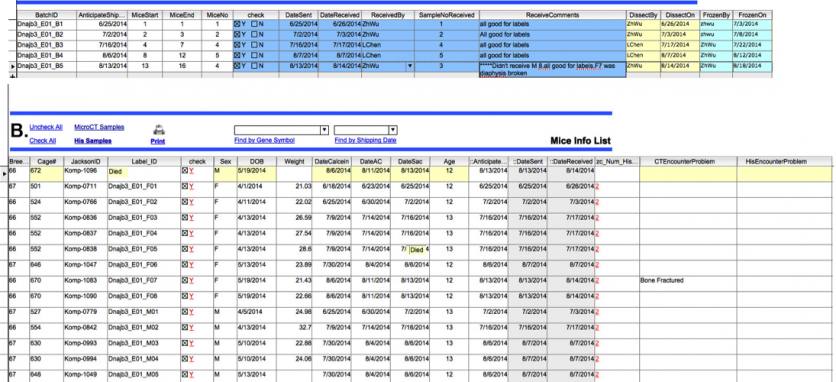
C. Receipt of the skeletal tissues: A different entry screen is used by the UConn Health distribution team (figure 4A) to confim that all the sent mice are received and are labeled correctly (figure 4). A tail snip is checked under the fluorescent microscope to ensure that each animal received the green and red mineralization label. If label is missing, an anticipated animal dies or a bone is fractured, we request a replacement animal to meet our goal of 8 mice per test group.
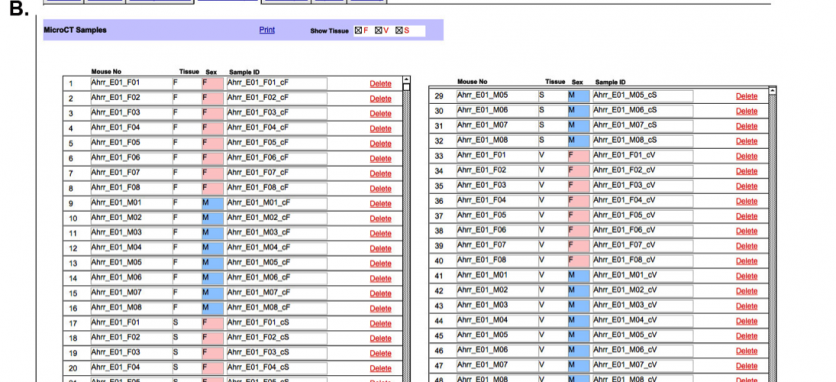
D. Distribution of the skeletal tissue for µCT analysis: Once a full set of tissues is accumulated (figure 6A), the µCT team is notified by a system-generated email. The identification label for each sample is generated for downloading and association with the samples names within the µCT analysis software (6B). The transfer date of the samples is noted and the progress of the analysis steps is recorded (fig 6C).
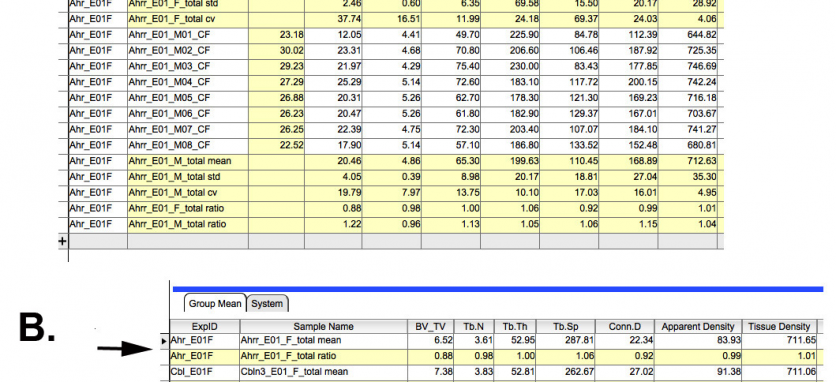
E. µCT screening for a trabecular or cortical bone abnormality. The long bone and vertebral samples are processed for µCT scanning. The µCT analysis generates an excel spreadsheet in which the samples are identified by the database-generated labels. The information is directly imported into the LIMS database including the statistical calculations for each group (figure 7A). The mean values for each KOMP line is then placed into summary table of all KOMP lines tested and the ratio of each values to the running means of the control animals is computed (figure 7B) and placed in the row beneath each KOMP entry. It is from this table that the decision to proceed to the dynamic and cellular histomorphometry is made.
E. Processing samples for histomorphometry: Long bone and vertebral samples identified by µCT as having significant bone variance will then be processed for bone histomorphometry in tissue section. Sample identity is preserved through a barcoded scheme where slides containing tissue sections are barcode labelled. These barcodes are then imaged at the same time tissue sections are imaged to acquire histomorphometry data. The nomenclature of image files contains as part of it an embedded barcode signature that retains the identity of datasets as they are computationally processed.

