Although microCT is not usually considered to be a high throughput platform for bone phenotyping, we have developed and use an automated, high-throughput microCT pipeline for phenotyping bone morphometry that allows this method to be just that. Key to the success of this was the development and utilization of instrumentation that increases the capacity per setup-session for the instrument. For this project, one genotype comprising 16 each (8 per group, males and females) of femurs and vertebrae can be loaded and imaged in approximately 8 hours of scanning time (80 minutes for each of four femurs, 40 minutes for each of 4 vertebrae).
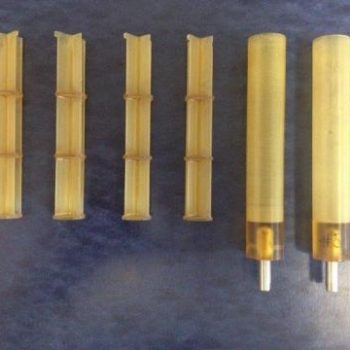
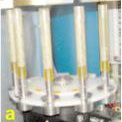
1. Sample Loading: The individual bones are placed in custom cruciform inserts that separate them into three stacks of four bones per insert. The bones are held place using dental wax. The inserts are then place in standard cylinderical holders.The inserts are loaded in a standard robotic carousel in a Scanco microCT 40 instrument. This carousel is capable of holding 10 cassettes, allowing up to 120 bones to be run per scan.
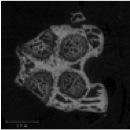
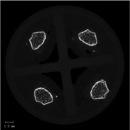
2. Definition of Regions of Interest: A batch script images the prescribed locations (A) and reconstructs digital images of each specimen automatically. An operator then selects reference sections at the growth plate (B) and the bone ends using the femoral head as the land mark on the proximal end and at the condyles of the knee on the distal end, from which another script automatically length scales and selects regions of interest (ROI) in the trabecular compartment of the distal femur (C) and mid-diaphyseal cortex. Each individual quadrants is reconstructed as an individual image by gene/specimen name.
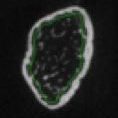
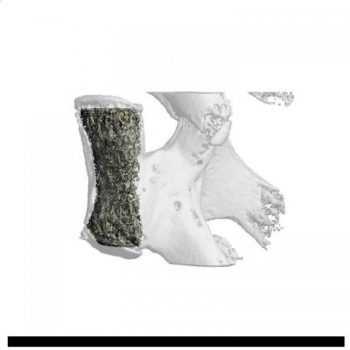
3. Data Analysis: The script then calculates automatically all geometric indices defining morphometry at both the distal femur and the cortical midshaft. Lumbar vertebrae are imaged using the same automated procedure and trabecular morphometry quantified within the central 80% of the vertebral body. Trabecular morphometry is assessed by measuring the bone volume fraction, trabecular thickness, trabecular number, trabecular spacing, connectivity density, plate versus rod structural index, normalized bone surface area, and tissue mineral density. Cortical morphometry is measured volumetrically (to increase accuracy), with subsequent mathematical reduction of volumetric data to parameters describing cross-sectional geometry by normalizing to diaphyseal span length. The screening includes measures of cortical cross-sectional area, cortical thickness, intracortical porosity, periosteal and endosteal area and perimeter length, and tissue mineral density. In femurs, flexural and polar moments of area (a.k.a. moments of inertia) and corresponding section moduli are calculated to indicate the geometrical stiffness and strength of the femur diaphysis, respectively. This is followed by an automated extraction of the data and a standardized assembly formating of the output file for automated upload into database.