A. Data Organization and Biological Classification
From individual measurements summary tables are generated that compare mutant group mean values to controls. It is at this step that a decision is made to flag a measurement that will be considered as abnormal. Although this abnormality-flag is initially made by a computer algorithm, all values are reviewed by the KOMP team to ensure that call is justified. The abnormal measurement flags are grouped in an analysis table according to structural and metabolic processes that have biological and functional meaning. The four major classifications are:
1. Trabecular architecture of the femur or vertebra – The primary screen of knockout mouse lines by µCT is the entry point for more detailed studies by histomorphometry. The trabecular bone volume measurement is dependent on the trabecular thickness or number value. This value is affected by the total bone volume (a measurement of size), which is also used as a searchable term. Secondary abnormalities of the trabeculae can include alterations in the plate/rod like structures of the trabeculae (shape) and/or a difference in mineral density of the trabeculae (density). Our experience to date has not observed alterations of structure or density independent of the BV/TV measurement.
Mutant mouse lines that trigger our histomorphometric study results in measurements for BV/TV, trabecular number and thickness from the histological sections. Although there is an impressive correlation between µCT and histomorphometry, there can be discrepancies in individual knockout mouse lines. At present we do not know if there is an explanation why these differences occur. We will place greater confidence in the µCT measurements.
Knockout mouse lines are studied at 3 months of age when femoral trabecular bone has reached its peak BV/TV after which it is lost, especially in female mice. Variation in BV/TV may reflect a primary genetic impact on trabecular bone mass or the rate at which bone is accrued or lost. These differences may be more prominent in females than males giving rise to a gender dimorphism. The BV/TV assessment in the vertebra is more stable with age, which may account smaller difference in this measure between the genders. Since axial and appendicular bone have a different embryonic origin, we are noting when there are gender dimorphic differences at both sites, or if the differences are similar in both sexes but different in the femur and vertebra (axial/appendicular dimorphism). Experience with increasing number of KOMP lines may provide more insight into these dimorphic differences.
2. Cortical bone architecture of the femur – The cortical bone of the femur carries the majority of the load of the femur and maintains its ability to remodel in response to an underlying genetic defect in bone quality. The primary measures are the thickness and the size (perimeter) of the cortical bone, which reflect the inherent osteogenic/osteoclastic cells to make cortical bone. The matrix composition is reflected by the density and porosity measurement, while remodeling activity can be observed in the elliptical shape of the diaphysis (min, max). The later measures may be abnormal in genetic disorders that affect bone quality.
Histomorphometry provides further insight into the cortical bone from the measurement of osteocyte density. There is a clear sexual dimorphic difference (females greater), but we have not yet observed a genetic difference. Measurements of bone formation, resorption and remodeling of the endosteal or periosteal cortical surfaces will be implemented in the near future.


3. Cellular activity of the trabecular bone of the femur and vertebra – The histomorphometric studies are designed to provide an indication of the type of alteration in the formation/resorption/ remodeling activity that could account for the architectural observations. The ability to associate features of formation and resorption on the same section provides measures that cannot be made or verified in traditional histology. Application of these measures across numerous control and KOMP lines will ultimately prove their utility in assessing the cellular activity affecting bone architecture. The major components of the analysis are:
a. Bone forming activity – This category identifies surfaces where formation, not associated with remodeling is occurring. It is composed of 2 measurements, which usually change in parallel.
Mineral apposition – The temporal incorporation of the mineralization dyes provides insight into the surfaces that are actively depositing new mineralized matrix. Either the percentage of the trabecular surface that is active (MS/BS) or the thickness of matrix that is produced (MAR) or both can be affected by genetic factors.
Osteoblastic activity – The total AP/BS measurement is partitioned to either the AP overlying a labeling surface per bone surface (AP_L/BS) or the proportion of total AP that overlie a labeling surface (AP_L/AP). Lining cells, which are considered to be quiescent, are identified as AP_NL/BS or AP_NL/AP.
b. Bone resorbing activity – This category identifies surfaces where resorption, not associated with formation, is occurring. The total TRAP/BS measurement is partitioned as TRAP activity overlying a non-labeling surface per bone surface (TRAP_NL/BS) or the proportion of total TRAP activity that overlies a non-labeling surface (TRAP_NL/TRAP).
c. Bone remodeling activity – The TRAP can also be on surfaces that show bone forming activity and we assume that it may represent sites undergoing active remodeling. The proportion of bone surface that shows overlapping forming and resorbing activity is captured by the measurement AP_TRAP_R_RG/BS.
4. Whole animal morphometry – (not yet implemented within the portal). Within the variation in body size of the running controls, we have not observed a correlation between body weight and the BV/TV measurement. However we expect that systemic disease that impacts somatic growth will also alter bone morphometry including femur length. The underlying disease may affect fat and muscle mass as well bone mineralization, which is reflected in the BMD measurement. These values have been imported from in the primary screen of the KOMP pipeline into our tables. Likewise chondrodystrophies affecting the growth plate may affect limb length with less of an affect on body weight. Animal lines that exhibit significant differences in whole body measurements will be identified and segregated from other KOMP lines that have normal whole body morphometry.
5. Biological classification – The table of searchable features for each analyzed KOMP line is presented on the selection table (yellow box) in figure 1A. The table indication if any skeletal measurement was found (Y or N). Based on the totality of the accumulated skeletal measures as classified in section A #1, 2 and 3) the KOMP staff will assign a biological mechanism to explain the skeletal phenotype of an individual KOMP line. A coding schema has been developed for facilitating computer searches:
Primary search term is base on the Bone Architecture Classification as obtained from µCT and static histomorphometric measure. It is based on the trabecular bone volume and total volumetric size of the bone (femur and/or vertebra), each of which can have 3 states (low, normal or high). The final phenotyping code captures both measurements for a total of 9 possibilities (see table 1).
The secondary search term is based on the three Cellular Phenotyping Classification: Formation, Resorption and Remodeling. Each classification has three states (low, normal or high) for a total of 27 possible phenotypes (see table 2). They are abbreviated as formation (LF, NF, HF), resorption or TRAP activity (LT,NT,HT) and remodeling (LR,NR,HR).
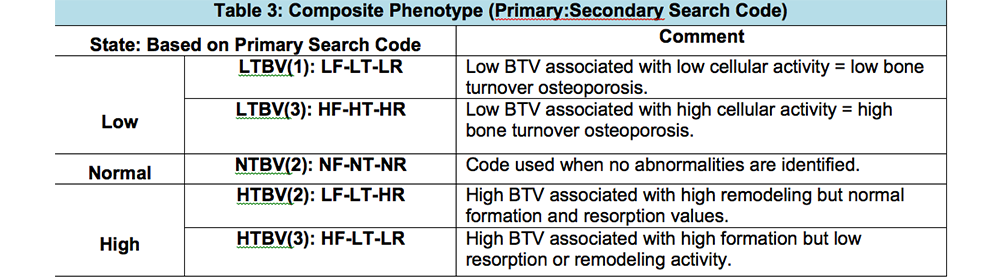
The composite phenotype code joins the architectural and cellular states that are separated by a colon. It will allow a search for either phenotypic state separately or in combination (see table 3).