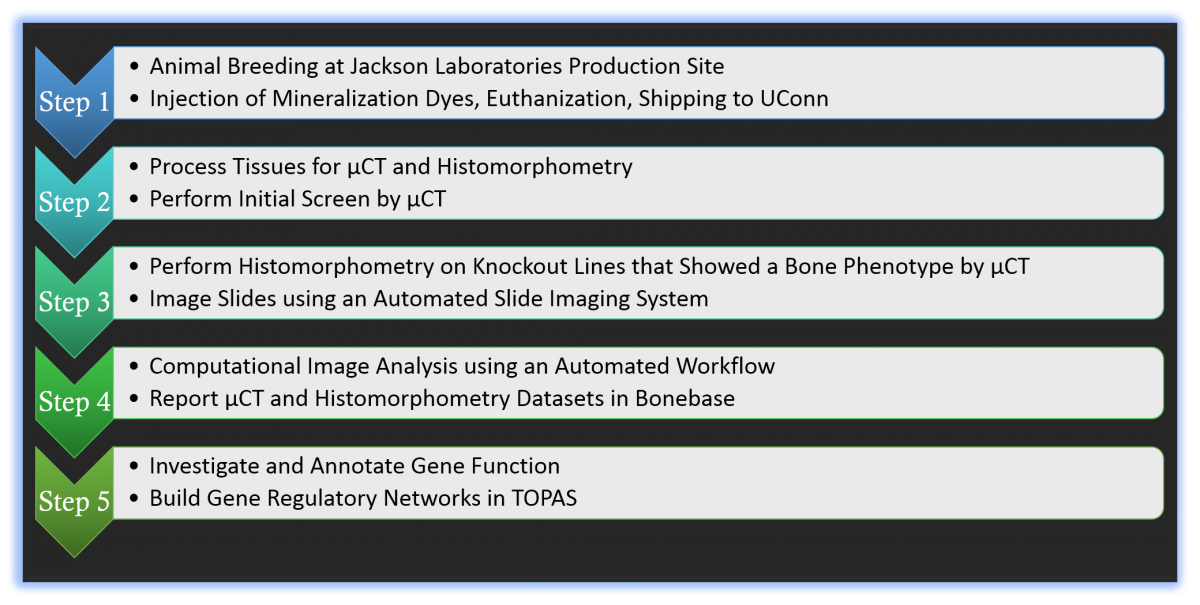
Workflow of Skeletal Phenotyping Pipeline
STEP 1: For Project 1, mouse lines were maintained at the KOMP Jackson Laboratories production site. Here collaborators injected mice with mineralization dyes, euthanized and shipped tissues to the UConn Farmington campus. Typically, two harem breeding cages were sufficient to produce our target of 10 male and female mice that are grown to 12 weeks of age. Mice were injected with calcein 7 days before sacrifice and alizarin complexone one day before sacrifice. Tissues (lower limbs, spine, head and a tail snip) were harvested in batches, placed in 10% neutral formalin, and shipped on ice to UConn.
STEP 2: At UConn, our staff confirms the identity of animals sent, and verify the injection of mineralization dyes by viewing tail snips under a fluorescent microscope. Samples that did not get labeled are replaced with two additional animals per gender, which are held in reserve from the breeding process. The processing site accumulates the tissues from each KO line until the full 8 samples per sex are received. Three days after formalin fixation, samples are placed in a barcoded vial containing cold 70% ethanol (µCT) or 30% sucrose/PBS (histology) and stored at -80ºC until all samples have been received. Barcoded samples are registered into a LIMS (Lab Information Management System).
Bone samples are initially screened by µCT analysis. The scanning process including ROI selection, thresholding, and calculating measurements, has been significantly upgraded to limit scanning times and technician effort. Weekly meetings are held to discuss µCT outcomes and select gene knockout lines for further histological analysis.
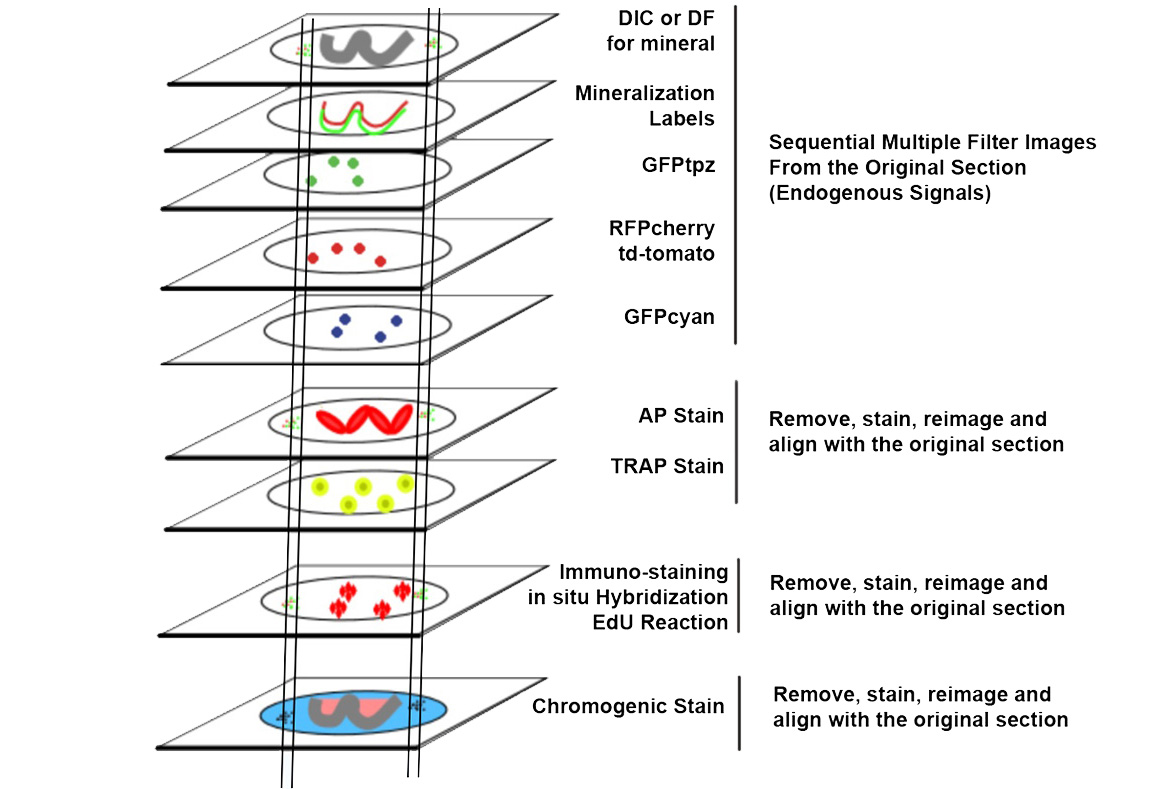
STEP 3: Bone histomorphometric analysis was performed on the distal femur and vertebral (V1-3) bodies. The sample-set of 16 long bones or vertebrae are processed as a single batch using a cryohistological protocol that has been developed in our laboratory. Three sections per each bone, sampled at 100µ intervals were analyzed. In this analysis, the same tissue sections undergo serial rounds of staining and re-imaging to obtain data from the same tissue sections. Data is acquired in a specific order: 1) bone mineral, 2) mineralization dye incorporation, 3) TRAP staining, 4) Alkaline phosphatase (AP) staining and DAPI, and 5) Toludine blue. To assure image registration over successive rounds of imaging, fluorescent beads are placed adjacent to each tissue section and are used to align images. The individual files from each round of imaging steps (approximately 4G of digital data), each with its unique name, is sent to a server located at the UConn Storrs campus.
STEP 4: Image analysis algorithms developed by Dr. Seung-Hyun (Sean) Hong are used to quantify specific fluorescent dye readouts relative to the bone tissue. This analysis has been adapted to a 24 node computer cluster that dramatically increases the throughput. Prior to running a study, the program checks the submitted files for problems that would require sample resubmission. Issues such as a weak enzyme stain, improper stitching, or an inadequate number of registration beads are problems that might require further attention by the histology staff. The analysis generates the histomorphometry measurements, identifies values that fall outside 1.5 SD of the group mean, and calculates the group means SD and p values. These calculations plus the computer-generated images on which the study was based are deposited into the LIMS database and presented on this website.
STEP 5: Gene knockouts identified as having significant skeletal variance relative to controls are further investigated through literature searches and accessible databases. Information learned about specific genes is present on this website. Further, mapping of genes to specific signaling pathways is performed using the TOPAS platform designed by Dr. Dong-Guk Shin.